All Business Growth Service clients have their own client portal, which contains their business data.
Our secure cloud-based system includes:
* Financials
* Benchmarking
* Key performance indicators
* Trended data
* Tax estimates
* Best practices
Financials
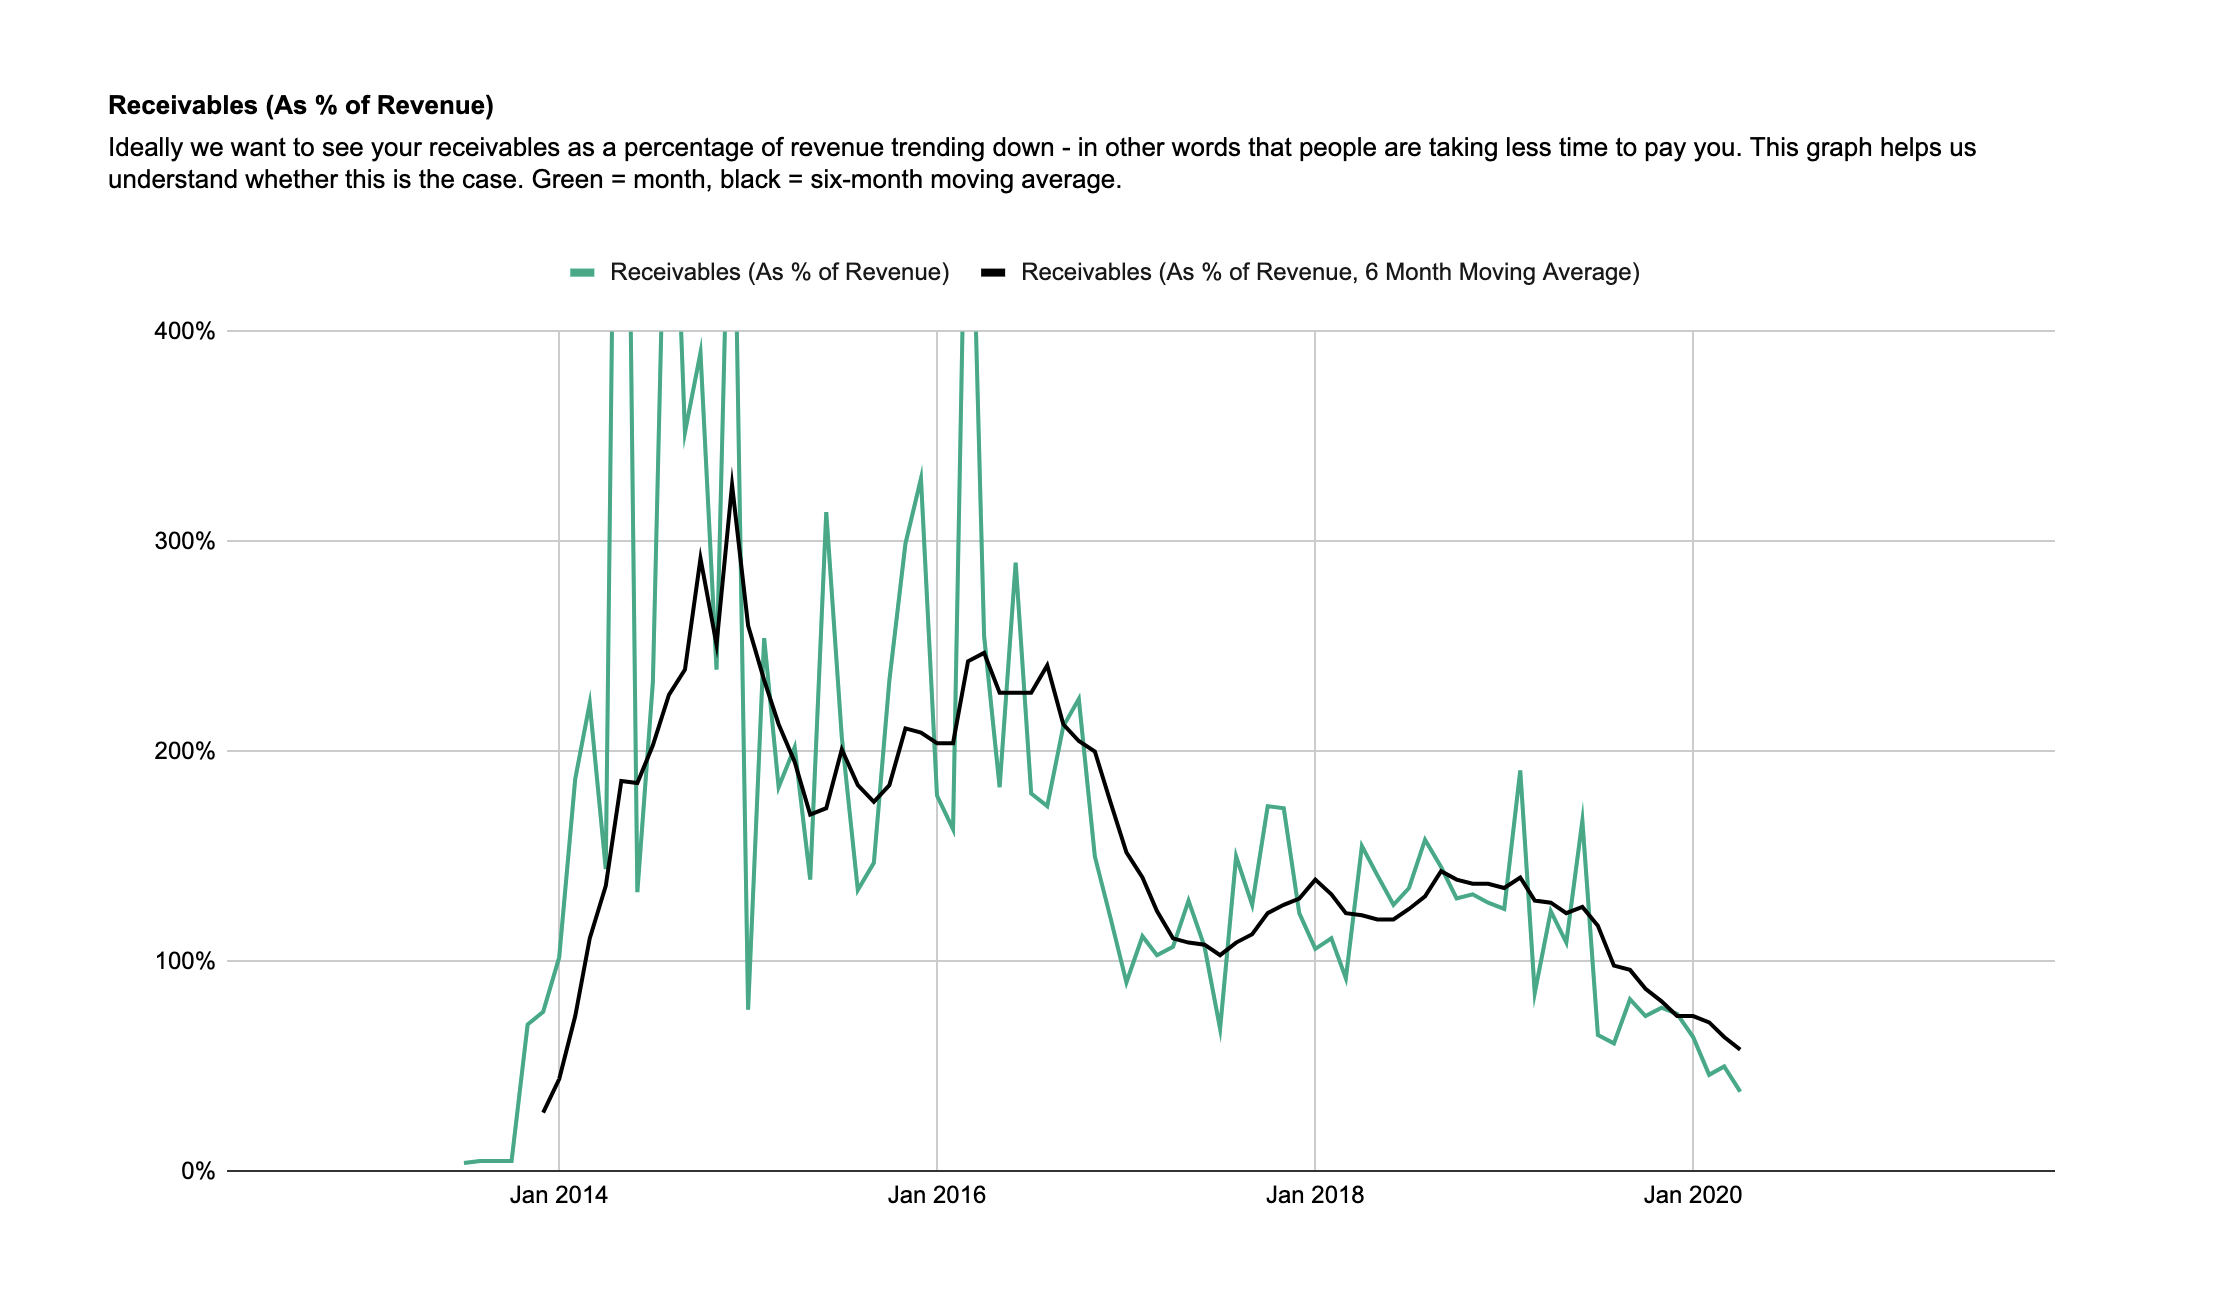
Graphs are a great way of visualising financial data, and helping small business owners to understand what the data is telling them.
For example, this graph shows receivables for a small business. Receivables means money owed to you – specifically, your outstanding invoices at the end of the month. It’s a really important measure because it directly affects how much cash there will be in your bank account.
This graph shows receivables as a percentage of revenue. For example, 100% would mean one months worth of revenue tied-up in receivables.
This small business has done really well over the last few years. They have reduced the amount of money owed to them. This has given them a six-figure bank balance and reduced bad debts.
Benchmarking
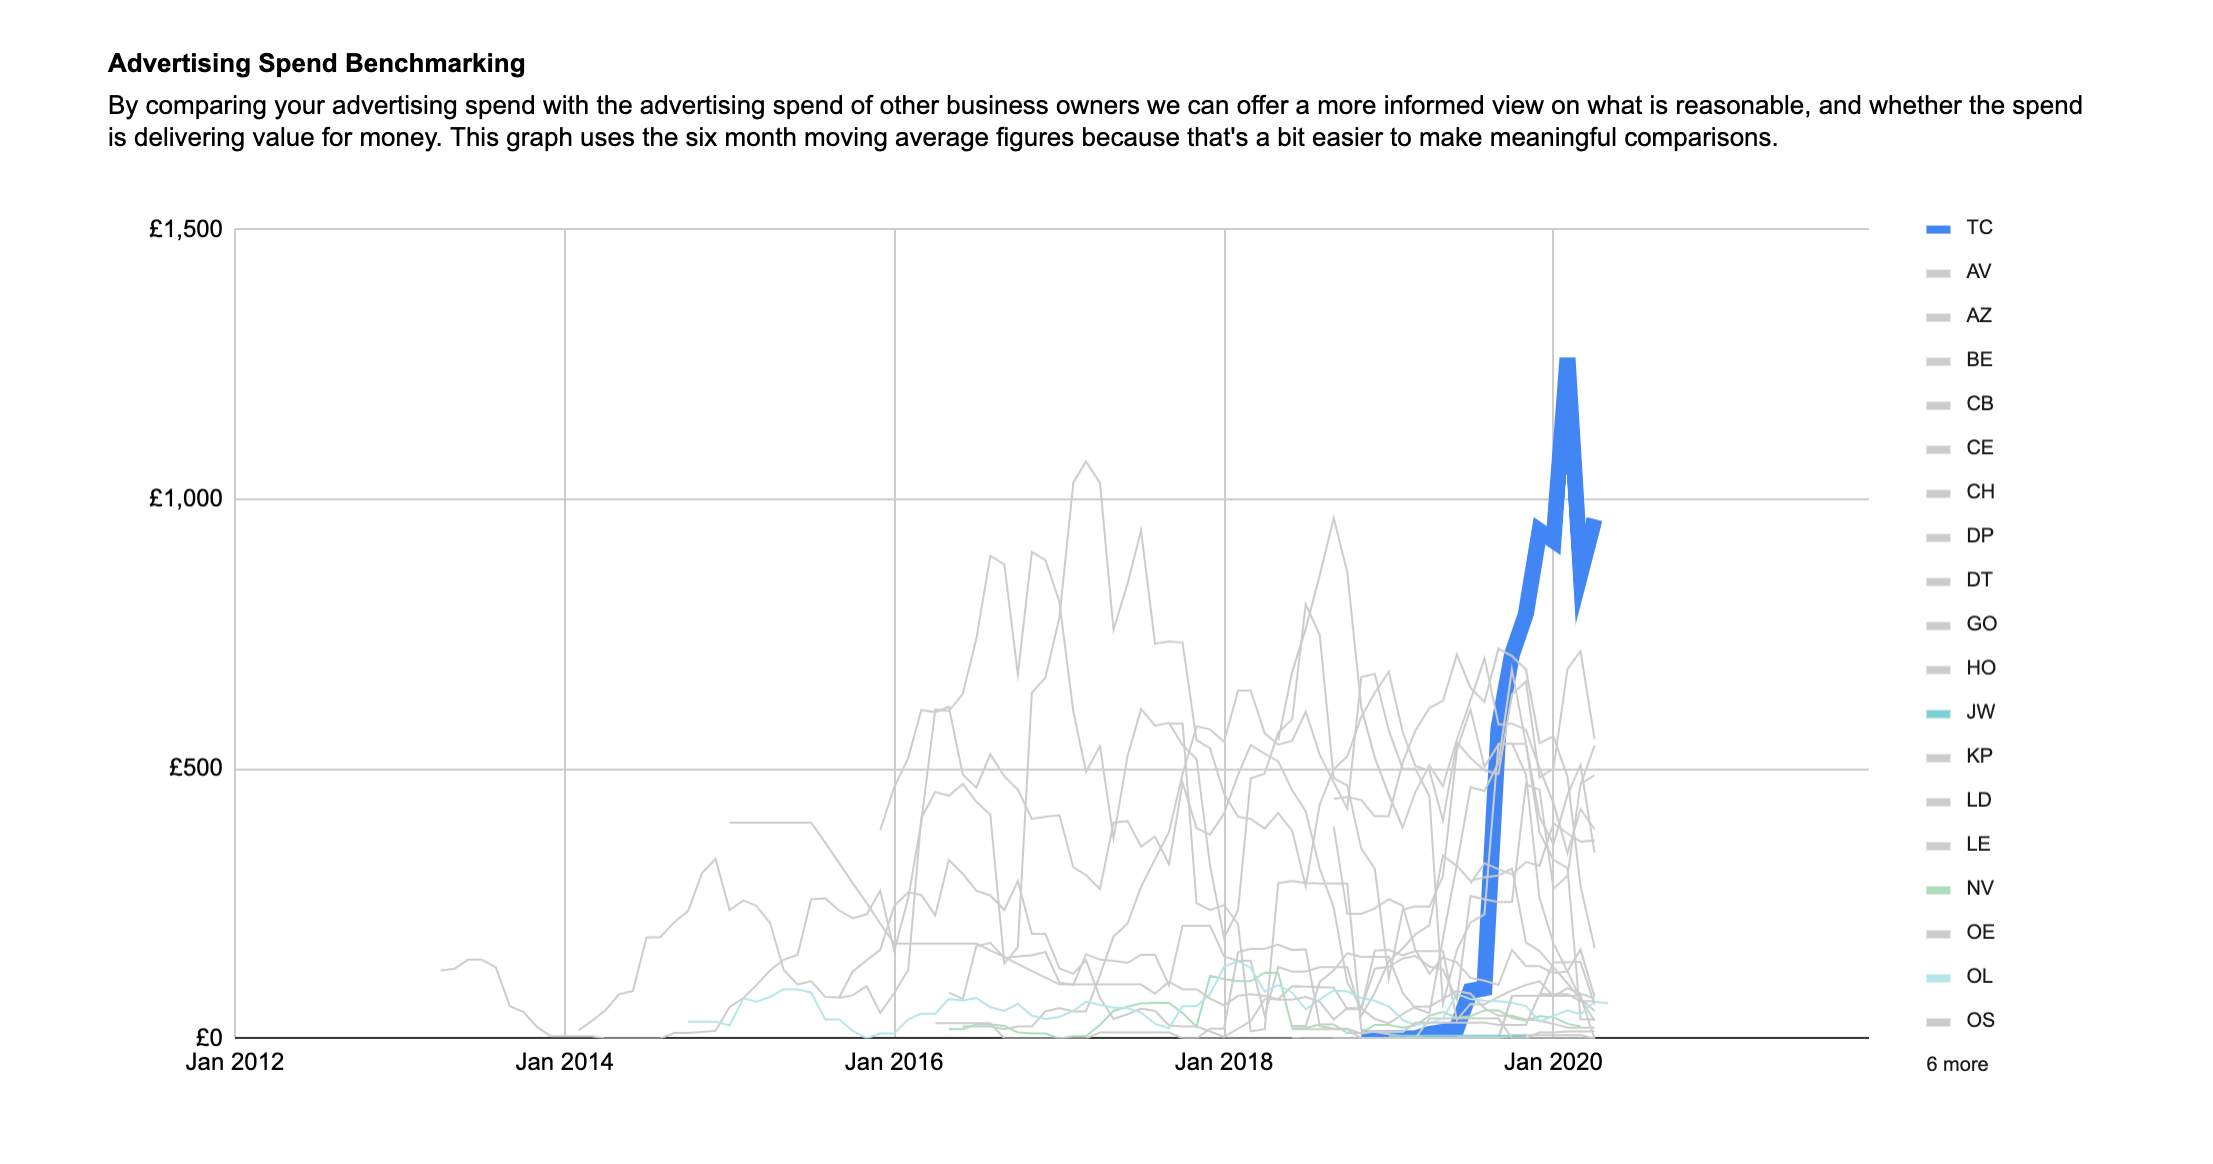
Benchmarking allows us to compare how you run your business with how lots of other people run their businesses. We benchmark you on things like your revenue growth, profits, receivables and more.
For example, the screenshot in this section shows advertising spend. The client shown in blue has recently increased their advertising spend, to a point where they are one of our biggest spenders.
Increasing advertising spend is fine if the advertising is generating a good number of new enquiries. But if the results aren’t quite as good as we would like then benchmarking helps us to say that the spend should be reduced.
Key Performance Indicators
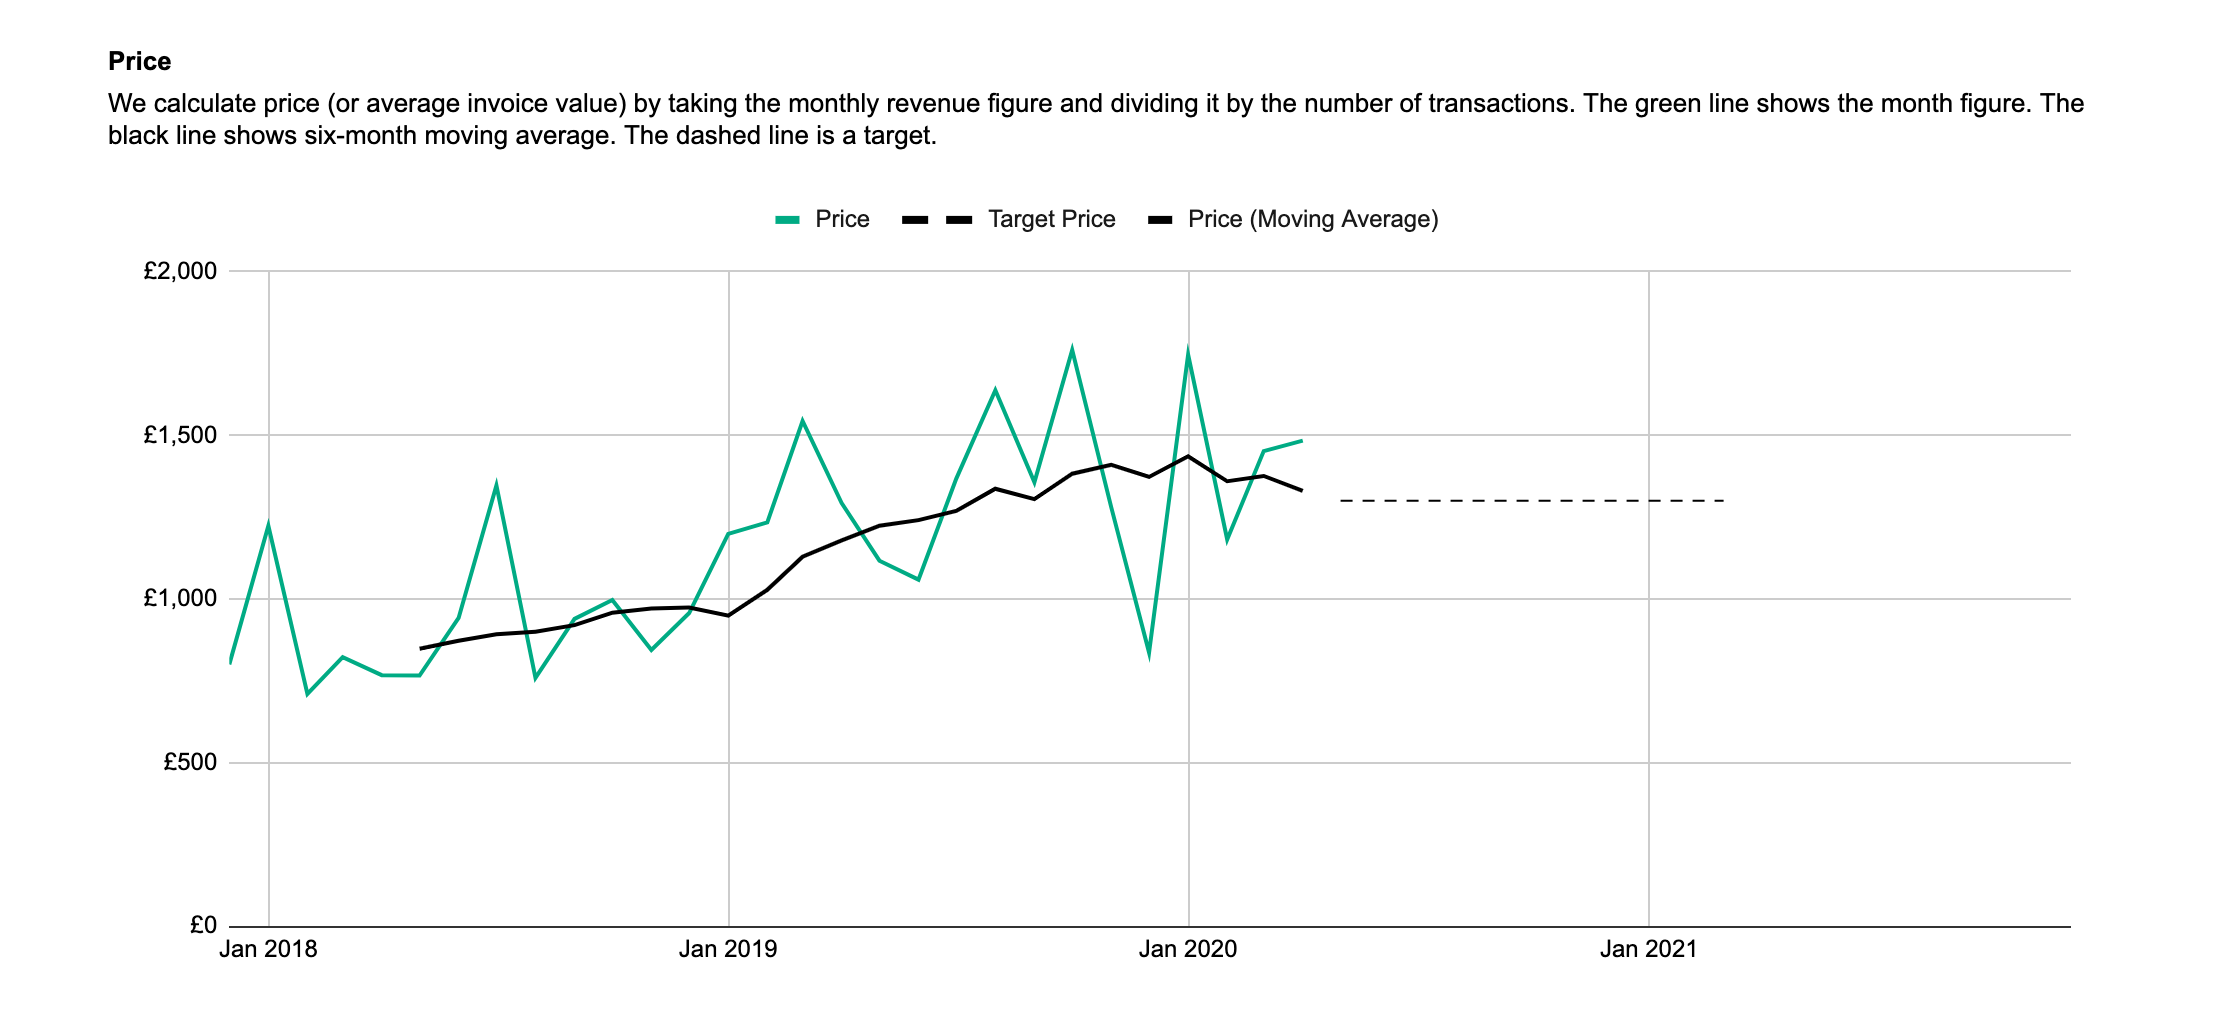
Key Performance Indicators (KPIs) are measures like the number of new enquiries, sales closed, and levels of repeat business. KPIs affect your revenue, profits and cash in the bank, so we watch them closely.
For example, the graph in this section shows how a small business has increased its average transaction value over the last couple of years, from below £1,000 per invoice to nearly £1,500 per invoice.
Transaction volume has also increased – thanks to good marketing and sales. More transactions and higher prices have allowed this business to increase revenue by approximately £300k.
Trended Data
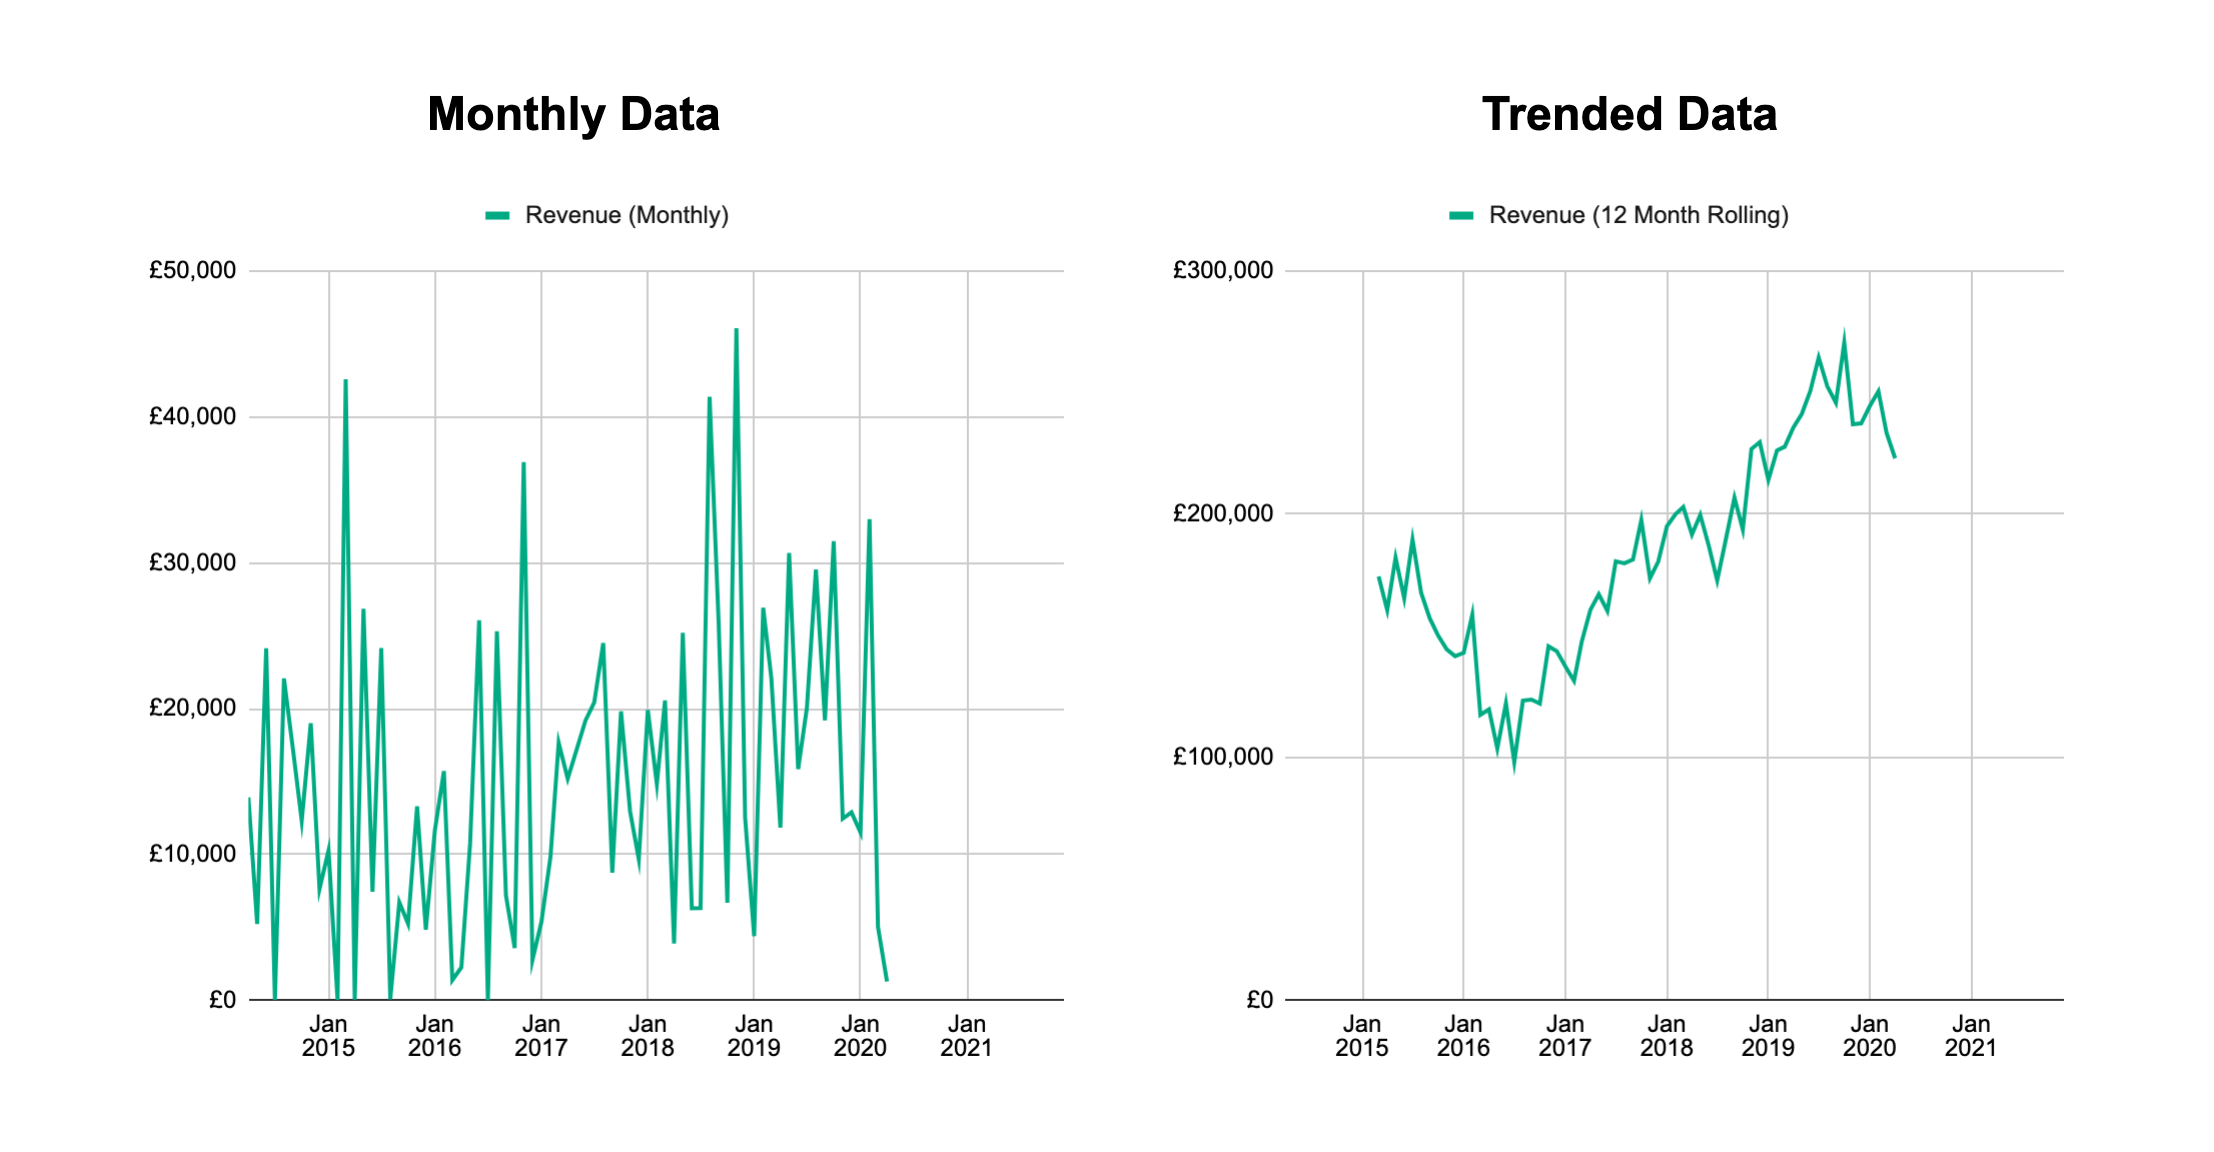
In many small businesses, financials can vary a lot from one month to the next. For example, if the business sells projects then invoices tend not to be raised at the same time each month. Some businesses are seasonal. Or some businesses buy stock in bulk. Reasons like these can cause the monthly financials to swing all over the place, making it hard to tell how well you’re doing. So we use trended data to solve this problem.
The left-hand graph shows monthly revenue for one of our clients. It varies a lot because this client projects. The right-hand graph shows the same data, but annualised. In other words, the total revenue in the 12 months to March, April, etc.
Trended data often makes it easier to understand how a business is performing.
Tax Estimates
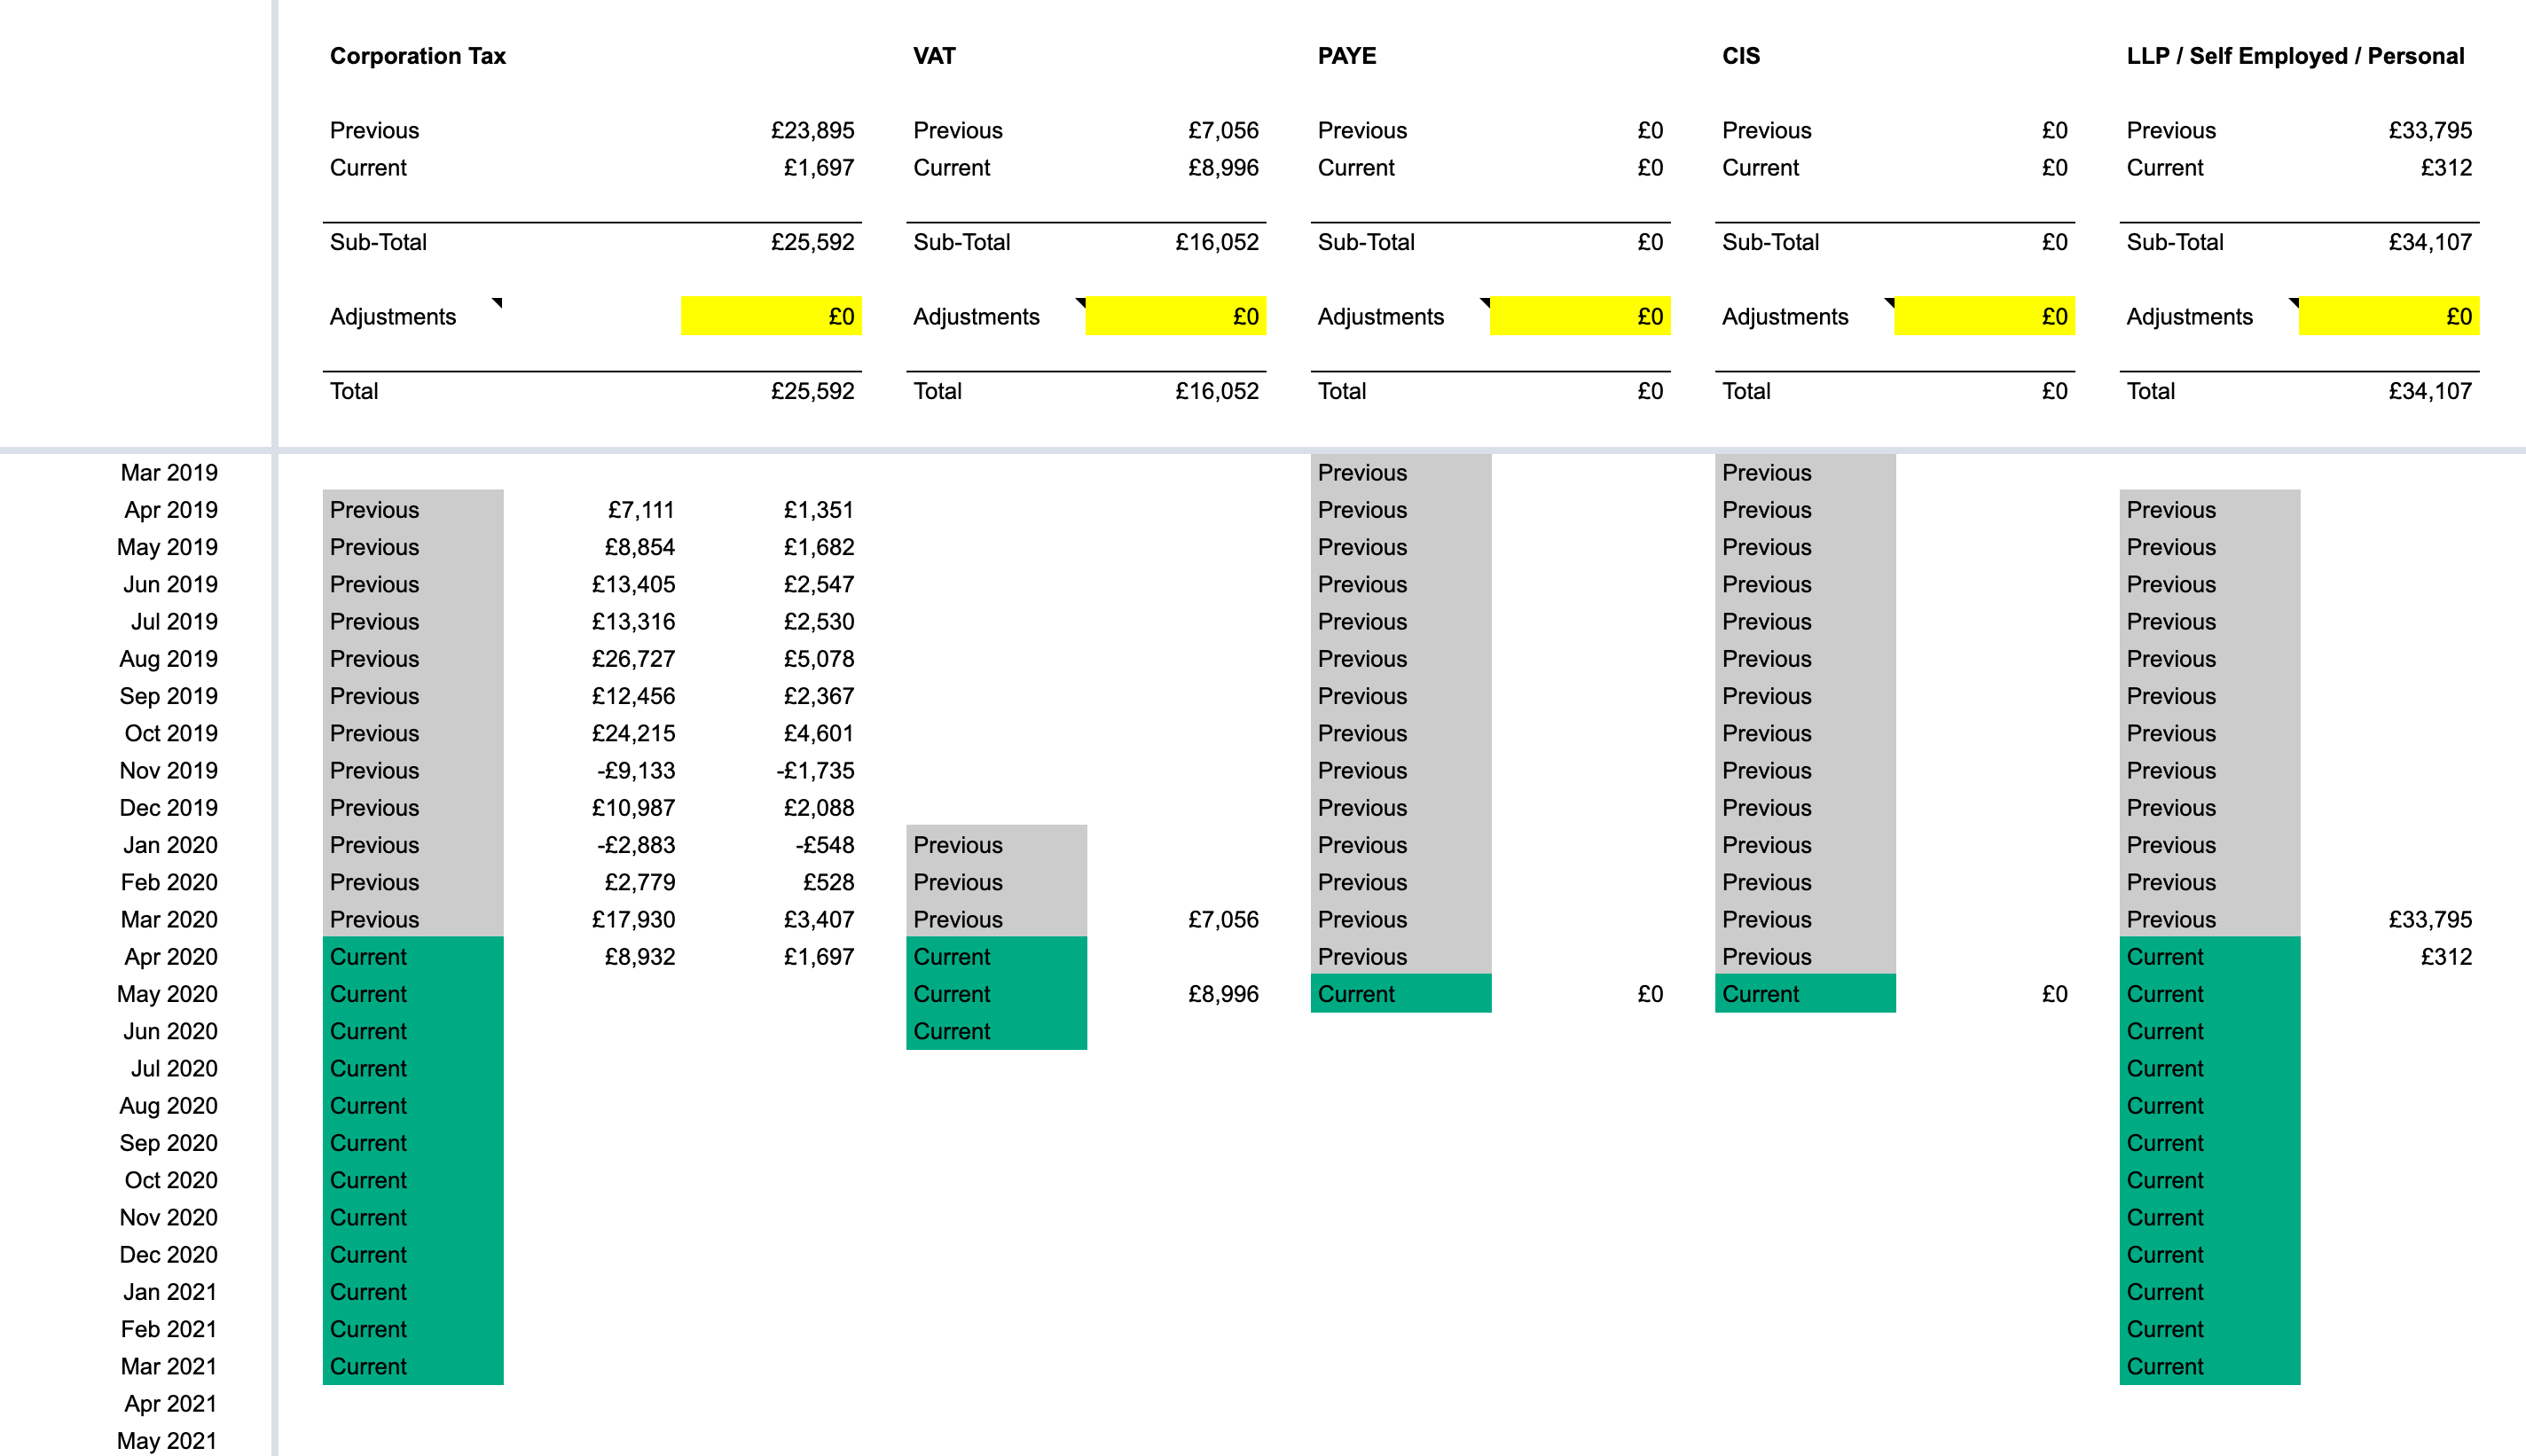
Tax in a small business can be complicated and cause problems. It can be hard to estimate. And sometimes tax bills can be bigger than expected, which can cause money problems.
We help our clients to estimate their tax liabilities every month. We estimate all of the major taxes. Then encourage our clients to put money to one side in a separate bank account to pay their taxes when they fall due.
Doing this helps to reduce unpleasant surprises. It also gives the small business owner a much better idea of how much cash is theirs, and how much is actually owed to HMRC.
Best Practices
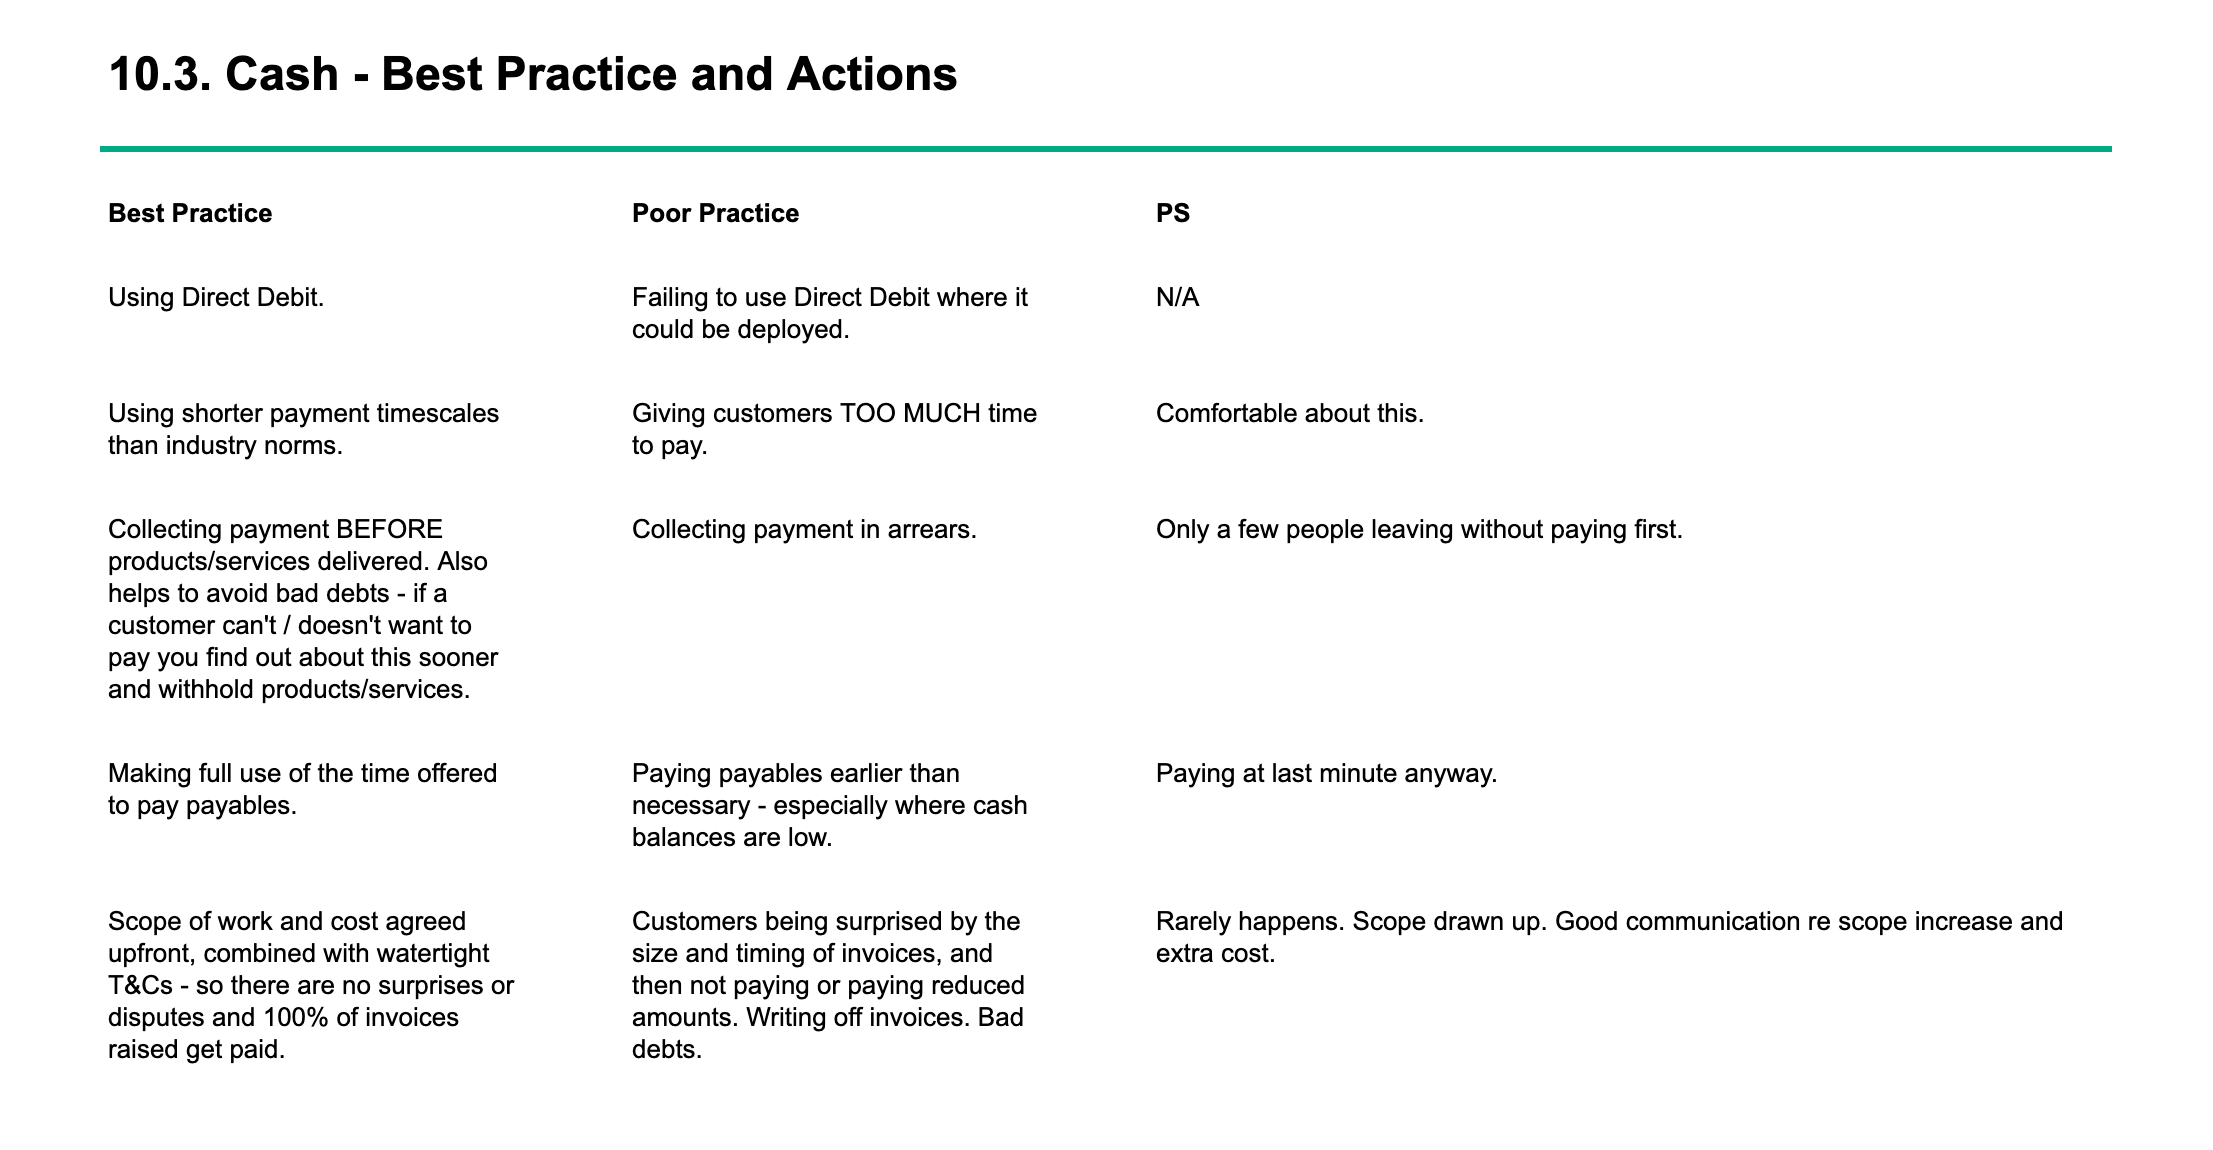
We maintain a list of best practices that we encourage our clients to follow. The best practices are listed in the portal alongside the relevant measure.
For example, here is a list of best practices for better management of cash in a small business. We also include poor practices and any actions that the client is taking to implement the best practices.
The best practices are things that we have first hand evidence of working. We see behind the scenes of lots of small businesses. We have a lot of data on what is best practice and what is poor practice.
If you would like to find out more about our Business Growth Service then click here.
If you have any questions about our Business Growth Service then please contact us.
